Using GIS to Teach Environmental History
Posted by Jesika Arseneau
27 January 2014 - 2:54pm
27 January 2014 - 2:54pm
 There can be no argument against the fact that today’s graduates are expected to be well rounded, inquisitive, and analytical – but more importantly, they are expected to be tech-savvy. As a recent graduate of a Master’s program myself, I find that today’s entry-level job positions go far beyond asking for the traditional skills that used to be acceptable resume features; no longer is it acceptable to write that you can competently use Microsoft Office and move on. Instead, today’s arts and culture field is searching for new graduates that are fully immersed in new and emerging technologies and completely confident in their abilities to use programs such as Photoshop, Dreamweaver, Google Apps, and more. Many students of history expect their work to be done mostly from textbooks and other forms of documents. This is an expectation that can and should be broken down in the classroom. New programs and websites, such as History Pin, seek to create communities surrounding the celebration of history, and do so by bringing people closer to historical events visually. Technology provides an engaging way for students to understand history, which I learned most recently through using GIS (Geographic Information System). GIS allows its users to visualize, analyze, and interpret patterns and trends of data using maps, reports, and charts. By compiling hardware, software, and data into one clean image, GIS is an excellent resource for historians to visually depict the past and understand changes, especially for the purposes of environmental history.
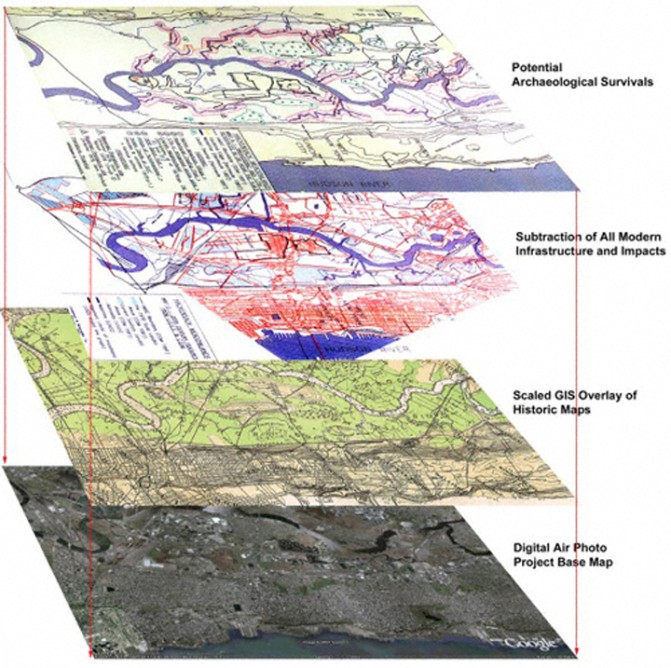
Originally used for environmental sciences and cartography, GIS systems are useful for digitizing and geo-referencing historical maps. GIS works similarly to Photoshop in the sense that you can have multiple layers working together to display one final product. Historical data can be entered to layer over modern GIS data, allowing students to visualize changes in environment over certain periods of time. I discovered this myself this past year, when I used GIS to map out a historical home I was proposing for heritage designation. Layering my historical data over current GIS data showed me the gradual changes in the neighbourhood’s environment, demonstrating how the river slowly receded and the resulting changes in terrain level around the home. This tool could be incredibly useful for the teaching of environmental history in the classroom in order to visually activate the implications of changes in environments for students. GIS can be difficult both to teach and learn – but it is not entirely necessary to focus on teaching the software to students at a young age, but rather to use the software as a visual demonstration. There are a large number of resources online that use GIS in pre-made lesson plans, in addition to projects available online for educational purposes.
GIS can be easily introduced to the classroom, even if it something as simple as asking students to find an interesting project online and present it to the class. In addition to the educational value this brings, it also exposes students to a fascinating program at a young age, making it possible for them to pursue it during further studies.
Here are some online resources you may find useful for your history lessons:
University of Toronto Map & Data Library
Historical GIS - The Imag(in)ing London Project
Historical GIS Research in Canada - Book
GIS for History - Includes Lesson Plans
Association of American Geographers - Historical GIS Clearinghouse and Forum
Mobile Mapping and Historical GIS in the Field
How do you communicate environmental change, and its historical impact, in your history lessons?
Photo: Courtesy of www.geospatialarchaeology.com
Historic GIS of Potentially surviving Cultural Resources beneath the now-inundated New Jersey Meadowlands - Grossman 1995, 2006